
Remote Sensing at IDWR
Remote sensing is the science of gathering information about the Earth from a distance. Instead of taking measurements on the ground, specialized sensors on satellites and aircraft capture detailed data and imagery of the landscape from above. IDWR uses publicly available remote sensing data to enhance workflows and support decision-making.
Uses of Remote Sensing Data
Remote sensing data is essential to the accurate and fair administration of water rights in Idaho. Department staff use off-the-shelf remote sensing-derived products, like USDA crop maps, and generate custom data products, tools, and analyses leveraging satellite and aerial imagery to support a variety of water resource management applications:
- Groundwater Modeling: Machine learning-generated irrigation maps and satellite-based ET are used to estimate groundwater withdrawals for groundwater-irrigated acres and incidental recharge on surface water-irrigated acres for models such as the Eastern Snake Plain Aquifer Model (ESPAM).
- Water Budgets: ET, irrigation maps, and gridded weather data are used to develop comprehensive water budgets for basin studies.
- Water Right Transfers and Rentals: When evaluating applications to transfer (or lease) a water right involving a change in the nature of use, remote sensing and weather data help determine the consumptive component of the water right, which is the only portion that can be transferred.
- Unauthorized Irrigation: IDWR identifies unauthorized irrigation spatially by overlaying “Place of Use” polygons with irrigation maps or maximum NDVI imagery. Imagery is also used to monitor compliance during water curtailments.
- Legal: Remote sensing datasets have also been used to support injury determinations during delivery calls.
Primary Data Sources
Most of IDWR’s remote sensing work is built on three publicly available imagery programs:
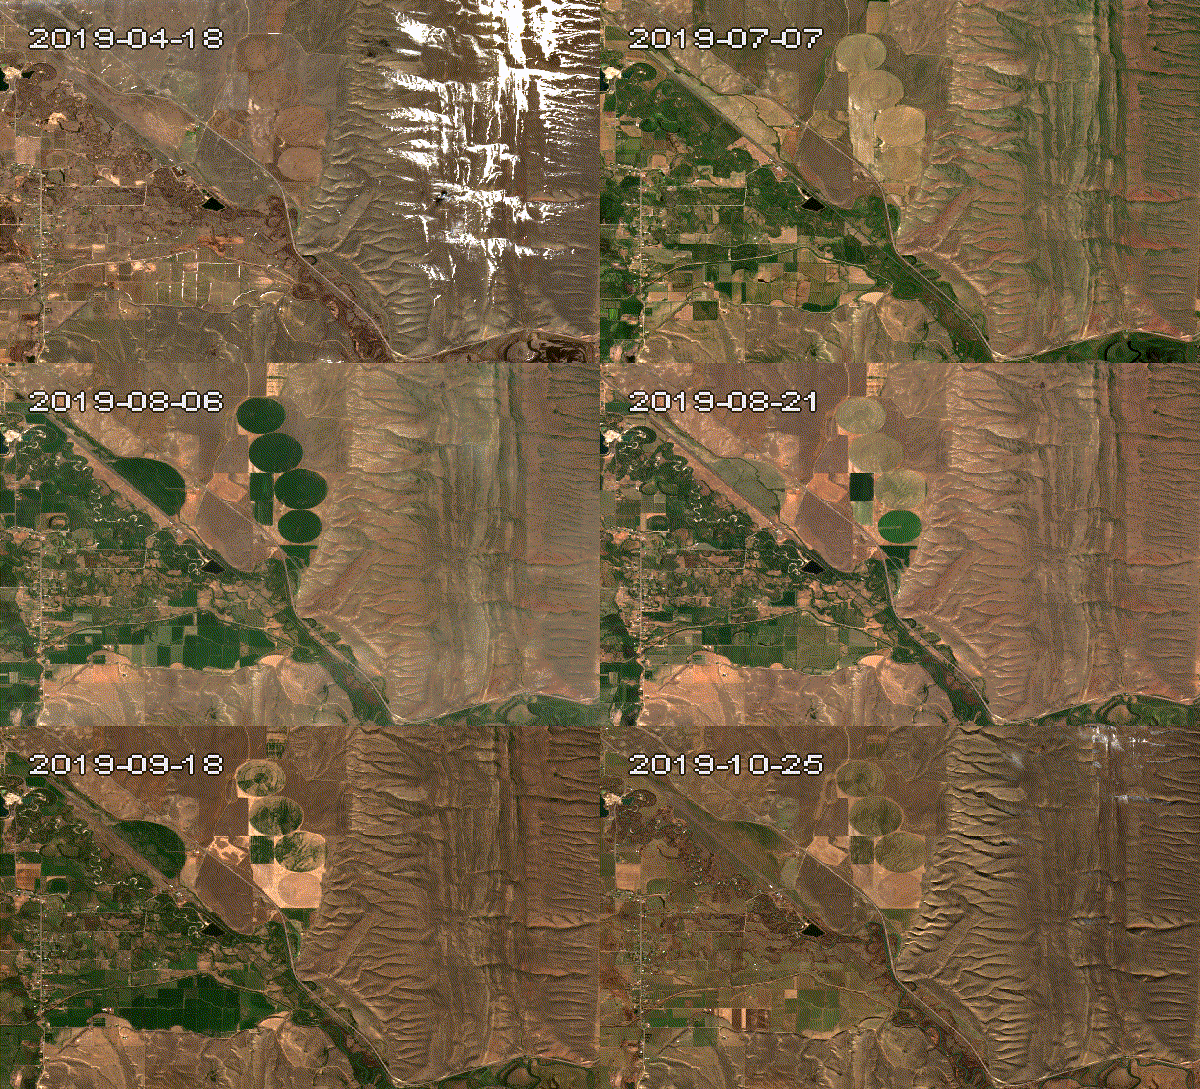
- Landsat (USGS/NASA): 30-meter multispectral imagery with thermal infrared bands, collected every 8 to 16 days. Landsat is the only public satellite program that measures land surface temperature at field scale, which is what makes satellite-based ET mapping possible. Its multi-decade archive also supports historical analyses.
- Sentinel-2 (ESA): 10-meter multispectral imagery on a roughly 5-day repeat. The finer resolution and more frequent revisit help resolve small fields and track crop development between Landsat overpasses.
- NAIP (USDA): aerial imagery at roughly 1-meter resolution, flown during the growing season every few years. The detail is fine enough to digitize field boundaries by hand and to identify irrigation infrastructure such as center pivots, ditches, and canals.
Irrigation Mapping
Knowing when and where irrigation is applied is critical for water management in Idaho. IDWR produces annual irrigation maps for modeling purposes and makes them publicly available through the IDWR Datahub. Mapping irrigation takes significant effort, but current technology has expedited it. On the IDWR Datahub, you will find two types of irrigation maps:
- Hand-Digitized Generated: A 3-class irrigation map (“irrigated”, “non-irrigated”, and “semi-irrigated”) that is hand-delineated by IDWR staff with the assistance of water right data and satellite/aerial imagery. This method took significant time and effort, and has since been sunsetted in favor of a machine learning approach (see below). These data are still available on the IDWR Datahub in vector file format. Note that these datasets contain a third class, “semi-irrigated”, which is used to denote small features like subdivisions where yards and houses are difficult to individually hand-digitize. See 2016 Irrigated Lands for the Eastern Snake Plain Aquifer: Hand-Digitized Generated as an example.
- Machine Learning Generated: A 2-class irrigation map (“irrigated”, “non-irrigated”) generated using machine learning and reviewed by IDWR staff before use. IDWR currently uses the random forest algorithm to map irrigation. This approach is fast, reproducible, and scalable. Machine learning-generated irrigation maps are produced in raster (image file) format, typically with 30-meter pixel resolution. See 2016 Irrigated Lands for the Eastern Snake Plain Aquifer: Machine Learning Generated as an example.
Evapotranspiration (ET)
Evapotranspiration, the sum of plant transpiration and evaporation from the surface, is water that is permanently lost to the State of Idaho. Water that evaporates or transpires after being diverted from its natural course and put to a beneficial use is called consumptive use. Irrigation is the largest consumptive use of water in Idaho. IDWR uses several advanced tools and models to quantify Evapotranspiration (ET):
- METRIC: Mapping EvapoTranspiration at high Resolution with Internalized Calibration. It is a satellite-based model originally developed in collaboration with the University of Idaho. It produces spatial maps of ET and is routinely used in basin water budget studies and groundwater models.
- ET-IDWR: A weather-based model that estimates ET and irrigation requirements at weather stations throughout the state. ET-IDWR is based on ETIdaho, a University of Idaho product, and uses the dual crop coefficient method to simulate crop development. This tool is routinely used for water budget studies and pond water right sizing. The Idaho Department of Environmental Quality uses the data for permitting land application of wastewater.
- OpenET: A non-profit organization that provides low-cost satellite-based ET data for farmers, ranchers, and water resource managers. IDWR, in collaboration with USGS, is currently using OpenET data to support the development of a Western Snake Plain Aquifer Model (WeSPAM), enhancing our ability to track and manage water resources in the region.
Resources
- IDWR Datahub – Download ET, Irrigation maps, and other data.
- OpenET – A collaborative platform providing satellite-based ET data across the western United States.